The Blurring of the Producer-User Divide in the Production of Visual Information
By Joost Grootens.
On the ever-decreasing distinction between those who produce digital data, those who design its visualization and those who use it as a new form of cartography
Mapmaking has been an essential part of human development since ancient times: through the art of cartography, people have been able to record geographical explorations and communicate spatial information in relation to themselves and the land around them, using fixed points and lived experiences as references. In the digital age, maps are just as likely to convey the relationships between individual users and amorphous data as they are to depict the relationships between human beings and the stars and planets above. Blind Maps and Blue Dots examines the impact of the omnipresent computer on current understandings of data visualization and graphic design, in which the boundaries between producers and users of maps has become increasingly blurred.
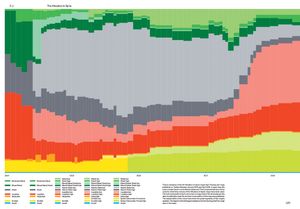
This text is structured around three contemporary mapmaking practices: Google Maps' location function, referred to as the Blue Dot; a global map that displays the physical activity of users of the fitness app Strava; and the Situation in Syria maps series, a regularly updated map of the Syrian conflict designed by an Amsterdam teenager. Like every other field, graphic design must evolve to reflect the modern world and the needs of its people. Blind Maps and Blue Dots offers a new approach that acknowledges and even encourages the breakdown of the binary between producer and user.
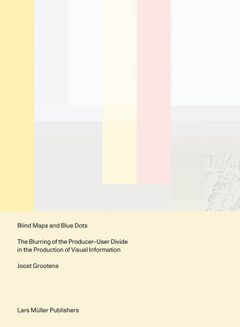
Featured image is reproduced from Blind Maps and Blue Dots'.
FORMAT: Pbk, 8.75 x 11.75 in. / 192 pgs / 47 color. LIST PRICE: U.S. $46.00 LIST PRICE: CANADA $64 ISBN: 9783037786581 PUBLISHER: Lars Müller Publishers AVAILABLE: 6/8/2021 DISTRIBUTION: D.A.P. RETAILER DISC: TRADE PUBLISHING STATUS: Active AVAILABILITY: In stock TERRITORY: NA LA
Blind Maps and Blue Dots The Blurring of the Producer-User Divide in the Production of Visual Information
Published by Lars Müller Publishers. By Joost Grootens.
On the ever-decreasing distinction between those who produce digital data, those who design its visualization and those who use it as a new form of cartography
Mapmaking has been an essential part of human development since ancient times: through the art of cartography, people have been able to record geographical explorations and communicate spatial information in relation to themselves and the land around them, using fixed points and lived experiences as references. In the digital age, maps are just as likely to convey the relationships between individual users and amorphous data as they are to depict the relationships between human beings and the stars and planets above. Blind Maps and Blue Dots examines the impact of the omnipresent computer on current understandings of data visualization and graphic design, in which the boundaries between producers and users of maps has become increasingly blurred.
This text is structured around three contemporary mapmaking practices: Google Maps' location function, referred to as the Blue Dot; a global map that displays the physical activity of users of the fitness app Strava; and the Situation in Syria maps series, a regularly updated map of the Syrian conflict designed by an Amsterdam teenager. Like every other field, graphic design must evolve to reflect the modern world and the needs of its people. Blind Maps and Blue Dots offers a new approach that acknowledges and even encourages the breakdown of the binary between producer and user.